

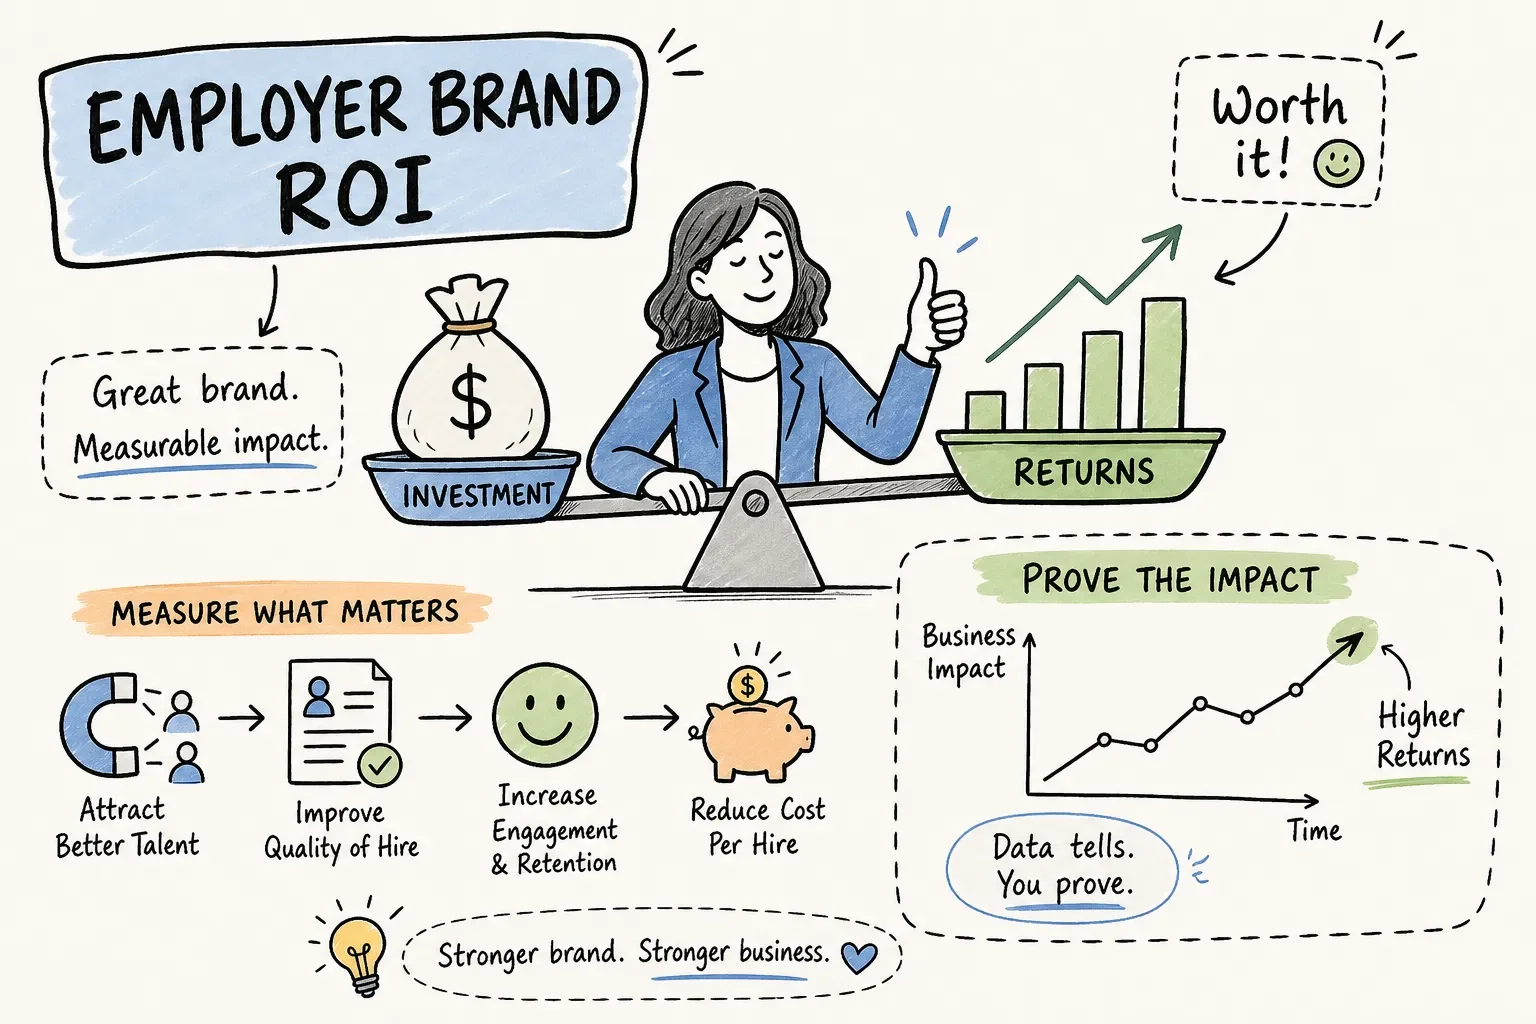
Proving employer brand ROI starts with a simple formula and baseline metrics, not narrative. Many HR leaders report positive effects from employer branding, yet the persistent challenge is demonstrating that value to a finance team that wants numbers. The return on employer branding is not a soft concept; it is a calculation, and it is more straightforward than most people realise.
Employer branding budgets get cut when their value stays invisible. It is a tendency we observe repeatedly at Let'z Talk, working with HR leaders and CEOs across India, and one that client engagements consistently confirm. The question before any employer branding project begins is almost always the same: "How do we show this actually paid off?" This article answers that directly, with a formula, seven KPIs, benchmark comparisons, and a structure for building a one-page stakeholder case. Measurement starts before a campaign launches, not after it ends, that principle shapes everything that follows.
Why most employer brand reports don't survive a finance review
The usual suspects in employer brand reporting are social impressions, career site traffic, and Glassdoor rating improvements. These are real metrics, and tracking them matters. Finance teams still dismiss them because they don't connect to numbers that appear in P&L conversations.
A defensible employer brand ROI is anchored in operational outcomes: reduced recruiting costs, faster hiring, higher offer acceptance rates, and lower voluntary turnover. These are figures your CFO already tracks. Framing the employer brand's contribution in those terms changes the conversation entirely. Awareness metrics serve as leading signals; they are not the proof itself.
Employer Brand ROI: Formula and Components
The core calculation is straightforward:
ROI (%) = [(Brand-driven financial benefits − Total employer brand investment) ÷ Total employer brand investment] × 100
Total investment covers campaign and content costs, career site and technology, events, paid media, vendor fees, and internal recruiter time attributed to employer brand work. Total benefits are the sum of four buckets: recruiting cost savings, vacancy savings, retention savings, and avoided re-fill costs from improved offer acceptance.
To make this concrete, consider an illustrative worked example: a company making 100 hires per year in India, with an average cost-per-hire of ₹85,000 (in line with 2026 India hiring benchmarks), reduces that figure by ₹40,000 per hire through stronger organic sourcing. That's ₹40 lakh in recruiting cost savings alone. Add 12 fewer days per vacancy across roles, 15 fewer voluntary departures at an average replacement cost of 1.25× annual salary, and an offer acceptance rate climbing from 72% to 85%, and the numbers accumulate quickly. In this scenario, a net benefit of ₹30 lakh against a ₹10 lakh investment puts the return at 200%. The ₹40,000 reduction figure is illustrative; your actual improvement will depend on your current sourcing mix and agency reliance.
Research on organisations with formal EVP communication suggests a 22% reduction in time-to-fill for critical roles in India. Globally, LinkedIn's Global Talent Trends data indicates that strong employer brands are associated with up to 50% lower cost-per-hire and 28% better retention. These are directional benchmarks, not guarantees, but they give you a credible range for your scenarios.
Seven KPIs to Prove Employer Brand ROI
Not all metrics deserve equal weight. Split your tracking across leading indicators and outcome indicators. The leading group tells you what's working now; the outcome group confirms the financial impact.
Four near-term signals to track:
Qualified applicant rate: the percentage of applicants who meet predefined minimum criteria. Tracks brand relevance, not just reach.
Time-to-hire: median days from application to accepted offer. Define the start point consistently and never confuse it with time-to-fill.
Offer acceptance rate: accepted offers divided by offers extended. A rising rate confirms stronger employer preference and EVP credibility.
Candidate experience score: average candidate rating collected at consistent hiring stages via CSAT or candidate NPS. This metric also captures recruitment ROI in terms of pipeline quality and drop-off reduction.
These four leading indicators give you early visibility into whether your employer brand investment is shifting candidate behaviour. Once they move, the lagging indicators below should follow within one to two hiring cycles.
Three lagging indicators that confirm financial impact:
Cost-per-hire: total recruiting expenditure, including agency fees, advertising, assessments, and internal recruiter time, divided by number of hires. This is your primary talent acquisition ROI metric.
Quality of hire: a composite measure assessed at 6 to 12 months using performance ratings, time to productivity, and manager satisfaction.
New-hire retention rate: percentage of a hire cohort still employed at 90 days, 6 months, and 12 months. Segment voluntary exits separately for clean attribution.
Why setting a baseline is the step most companies skip
Without a documented baseline, any improvement is anecdotal. Finance teams need a before-and-after comparison, not a snapshot of where things stand today. Before any programme launches, record cost-per-hire by role family, average time-to-fill, offer acceptance rate, voluntary turnover, agency spend, and early-attrition rate within 90 and 180 days.
A 12-month baseline period is standard; 24 months is stronger because it smooths seasonal hiring variation and gives you a more credible comparison period. Without this starting point, you are reporting a current state, not a measurable return.
At Let'z Talk, we built the Well-Being Diagnosis specifically for this moment. It evaluates culture, engagement, and work environment across the organisation, surfacing the gaps that employer brand investment is designed to close. Once those gaps are documented, every subsequent improvement becomes measurable, that is how employer brand ROI moves from estimated to defensible. Engagement scores feed directly into retention projections; culture gaps inform EVP positioning; work environment data shapes what candidates actually see.
Building a one-page stakeholder case that gets approved
The most effective format for a finance-ready case is a simple benefits bridge table: benefit category, calculation method, and annual value. Rows cover agency savings, lower cost-per-hire, reduced vacancy days, improved offer acceptance, and retention savings. Final rows show total gross benefit, total investment, net benefit, and ROI percentage.
Present three scenarios: conservative (hard savings only), central (hard savings plus vacancy and offer acceptance improvements), and upside (includes quality-of-hire and productivity gains). This signals rigour, not optimism. Also report the payback period, which is your investment divided by average monthly quantified benefit. Short payback periods, for example, 6 to 9 months, are a persuasive figure in any budget conversation; the exact period will depend on your investment level and the savings assumptions in your central scenario.
One attribution safeguard that protects the case: attribute only the incremental improvement, not the entire observed change, to employer brand activity. Compare pre- and post-periods with similar hiring volumes and adjust for market conditions, restructures, or hiring freezes.
The strongest cases combine hard savings such as agency fees and replacement costs with operational value from shorter vacancies and faster ramp-up times. That combination prevents the analysis from resting on brand metrics alone and gives finance stakeholders a figure they can reconcile against existing cost-centre data.
Start measuring before the next campaign launches
The path from employer brand investment to a defensible return runs through four steps: set the formula, select the right KPIs, document the baseline, and structure the one-page case. None of this is creative work. It is financial discipline, and it begins before any campaign goes live.
Organisations in India with formal EVP communication consistently see measurable improvements across hiring speed, cost, and retention, including the 22% faster time-to-fill noted earlier. The data exists, and it is replicable for companies willing to measure from the start.
If you are not sure where your baseline sits today, Let'z Talk's free employer brand audit gives you the starting point, covering your current cost-per-hire, offer acceptance rate, and early-attrition benchmarks so you enter any branding investment with a clear before position. Use the audit and the KPIs above to demonstrate clear employer brand ROI to finance stakeholders. When the results come in, you will have the numbers to substantiate the investment case. Employer branding is not a line item to justify once and move on from. It is a long-term talent advantage, and the organisations that measure it properly are the ones that keep it funded.
